
Data is king and its power can’t be understated. You collect, analyze, and interpret data to gain worthy business outcomes. Unlocking this power lies within management reports.
As businesses are becoming more data-driven, the demand for accurate and insightful management reports has surged. These reports offer a holistic view of various aspects of an organization, such as financial performance, operational efficiency, market trends, and customer behavior. By presenting complex data in a digestible format, these reports empower teams to identify patterns, trends, and opportunities that may otherwise go unnoticed.
In this blog post, we understand the need for and importance of management reports, various types, audiences, and much more. We also see the different KPIs inside such reports and how they differ from traditional financial reports. Let’s get up to speed.
What is management reporting, and how did it all begin?
Management reporting helps businesses and teams track, analyze, and improve their performance across various aspects. Often referred to as managerial reporting, it offers data and insights to decision-makers within an organization.
While initially, it started in the 19th and early 20th centuries, it was driven by several factors — the Industrial Revolution, the Development of Accounting Standards, and Tech Advancements. From reporting financial metrics like revenue, expenses, and profitability to tracking operational performance and marketing & sales, management reporting had its significant journey.
And modern management reporting has to do more with data analytics and visualization. Yes, business intelligence platforms are deployed continuously to help business teams transform data into insights. It is becoming increasingly sophisticated and integrated with real-time data, enabling instantaneous decision-making.
Who uses management reports, and why are they crucial?
Management reports are used by various members within an organization, with each having their individual needs. Let’s look through this with the help of the following table—
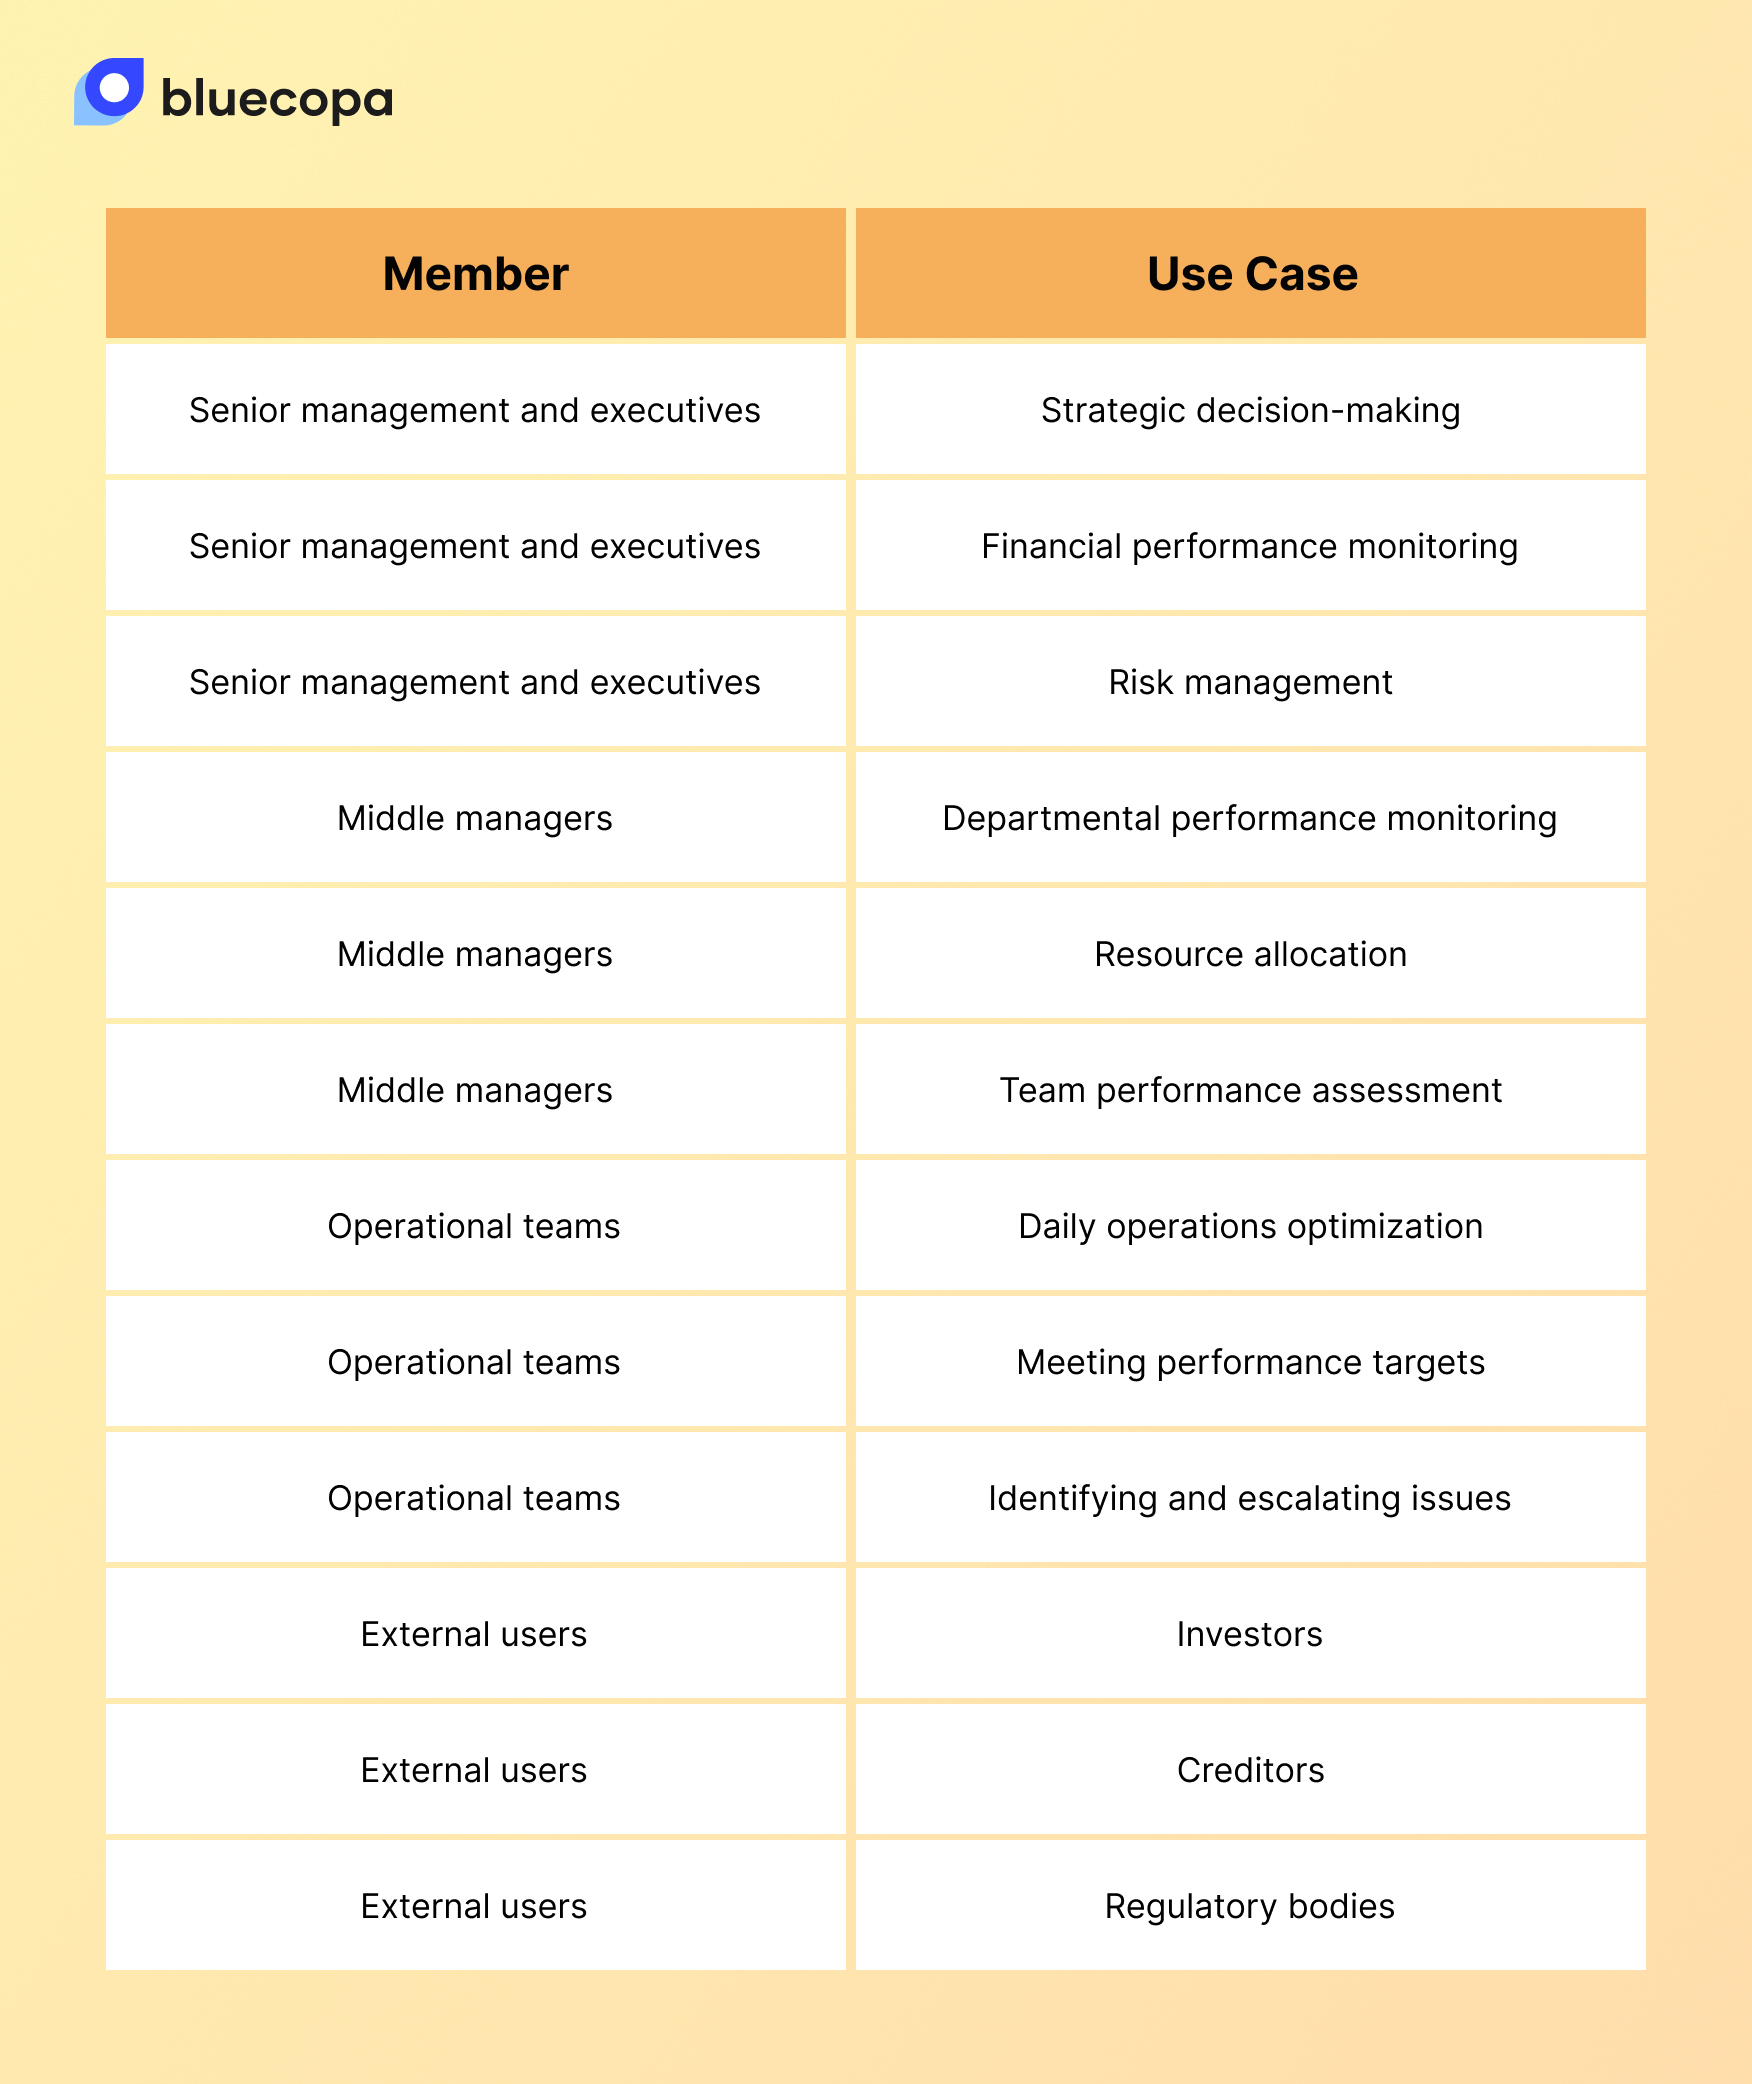
So, why are they important? For various reasons like enhanced accountability, collaboration, and proactive problem-solving. We can condense the need into themes like:
- Taking the guesswork or intuition out of the equation
- Improving visibility into several areas of the business
- Tracking progress toward goals and measuring the effectiveness of strategies
Frequent financial management reports help teams with up-to-date data. They help move the needle like progressing a company in the right direction. Moreover, these reports enable finance teams to report on those areas of business, the CEO is most interested in.
Financial reports vs Management reports
Financial reports are produced for legal requirements, mostly fixated on historical data. However, management reports are produced keeping in mind the business decision-making. They differ in many ways including—
Purpose
- Financial reports: Primarily intended for external stakeholders like investors, creditors, and regulators. They aim to showcase a company's financial health, profitability, and compliance with regulations.
- Management reports: Designed for internal decision-making by managers and executives. They provide deeper insights beyond pure financial numbers, focusing on specific areas and operational aspects.
Content
- Financial reports: Primarily utilize standardized financial data based on Generally Accepted Accounting Principles (GAAP) or similar frameworks. They present historical information in formats like income statements, balance sheets, and cash flow statements.
- Management reports: More flexible and customizable. They can include financial data, operational metrics (e.g., production efficiency, customer satisfaction), and even non-quantitative information like employee feedback. They can be tailored to specific departments, projects, or strategic initiatives.
Frequency
- Financial reports: Typically issued quarterly or annually, following mandated schedules.
- Management reports: These can be generated daily, weekly, monthly, or quarterly, depending on the information needs and decision cycles.
Accessibility
- Financial reports: Publicly available for most publicly traded companies.
- Management reports: Internal documents, not shared externally.
Sample questions management reports help you answer
Management reports are designed to answer several questions that emerge within teams. Some of them are below—
- Sales team: Are we meeting our sales targets by region or product segment? Which marketing channels are driving the most revenue?
- Production team: What is our current inventory level? Are there any bottlenecks affecting production efficiency?
- Human resources: What is our employee turnover rate? How engaged are our employees?
- Marketing team: Which marketing campaigns are generating the most leads and conversions? What is the return on investment for our marketing efforts?
- Senior management: Are we on track to achieve our strategic goals? How do our key performance indicators compare to industry benchmarks? Are there any potential risks or opportunities on the horizon?
What are some KPIs inside management reports?
The specific KPIs used will vary depending on the organization, industry, and specific needs of the report. However, here are some examples of common KPIs across different departments:
Sales & Marketing
- Customer acquisition cost (CAC): This measures the average cost of acquiring a new customer.
- Sales conversion rate: This shows the percentage of leads that convert into paying customers.
- Customer lifetime value (CLTV): This measures the total revenue a customer generates throughout their relationship with the company.
- Return on investment (ROI) for marketing campaigns: This helps assess the effectiveness of marketing efforts.
- Brand awareness: This tracks how well the brand is recognized by the target audience.
Operations
- Inventory turnover rate: This measures how efficiently inventory is used and managed.
- Production efficiency: This shows how much output is produced per unit of input.
- Defect rate: This measures the percentage of faulty products.
- On-time delivery rate: This tracks the percentage of orders delivered on schedule.
- Machine downtime: This measures the amount of time production machines are unavailable.
Finance
- Revenue growth: This measures the increase in sales revenue over a period.
- Profit margin: This shows the percentage of revenue that remains after deducting costs.
- Debt-to-equity ratio: This measures the company's financial leverage.
- Cash flow: This tracks the inflow and outflow of cash.
- Return on assets (ROA): This measures how efficiently the company uses its assets to generate profit.
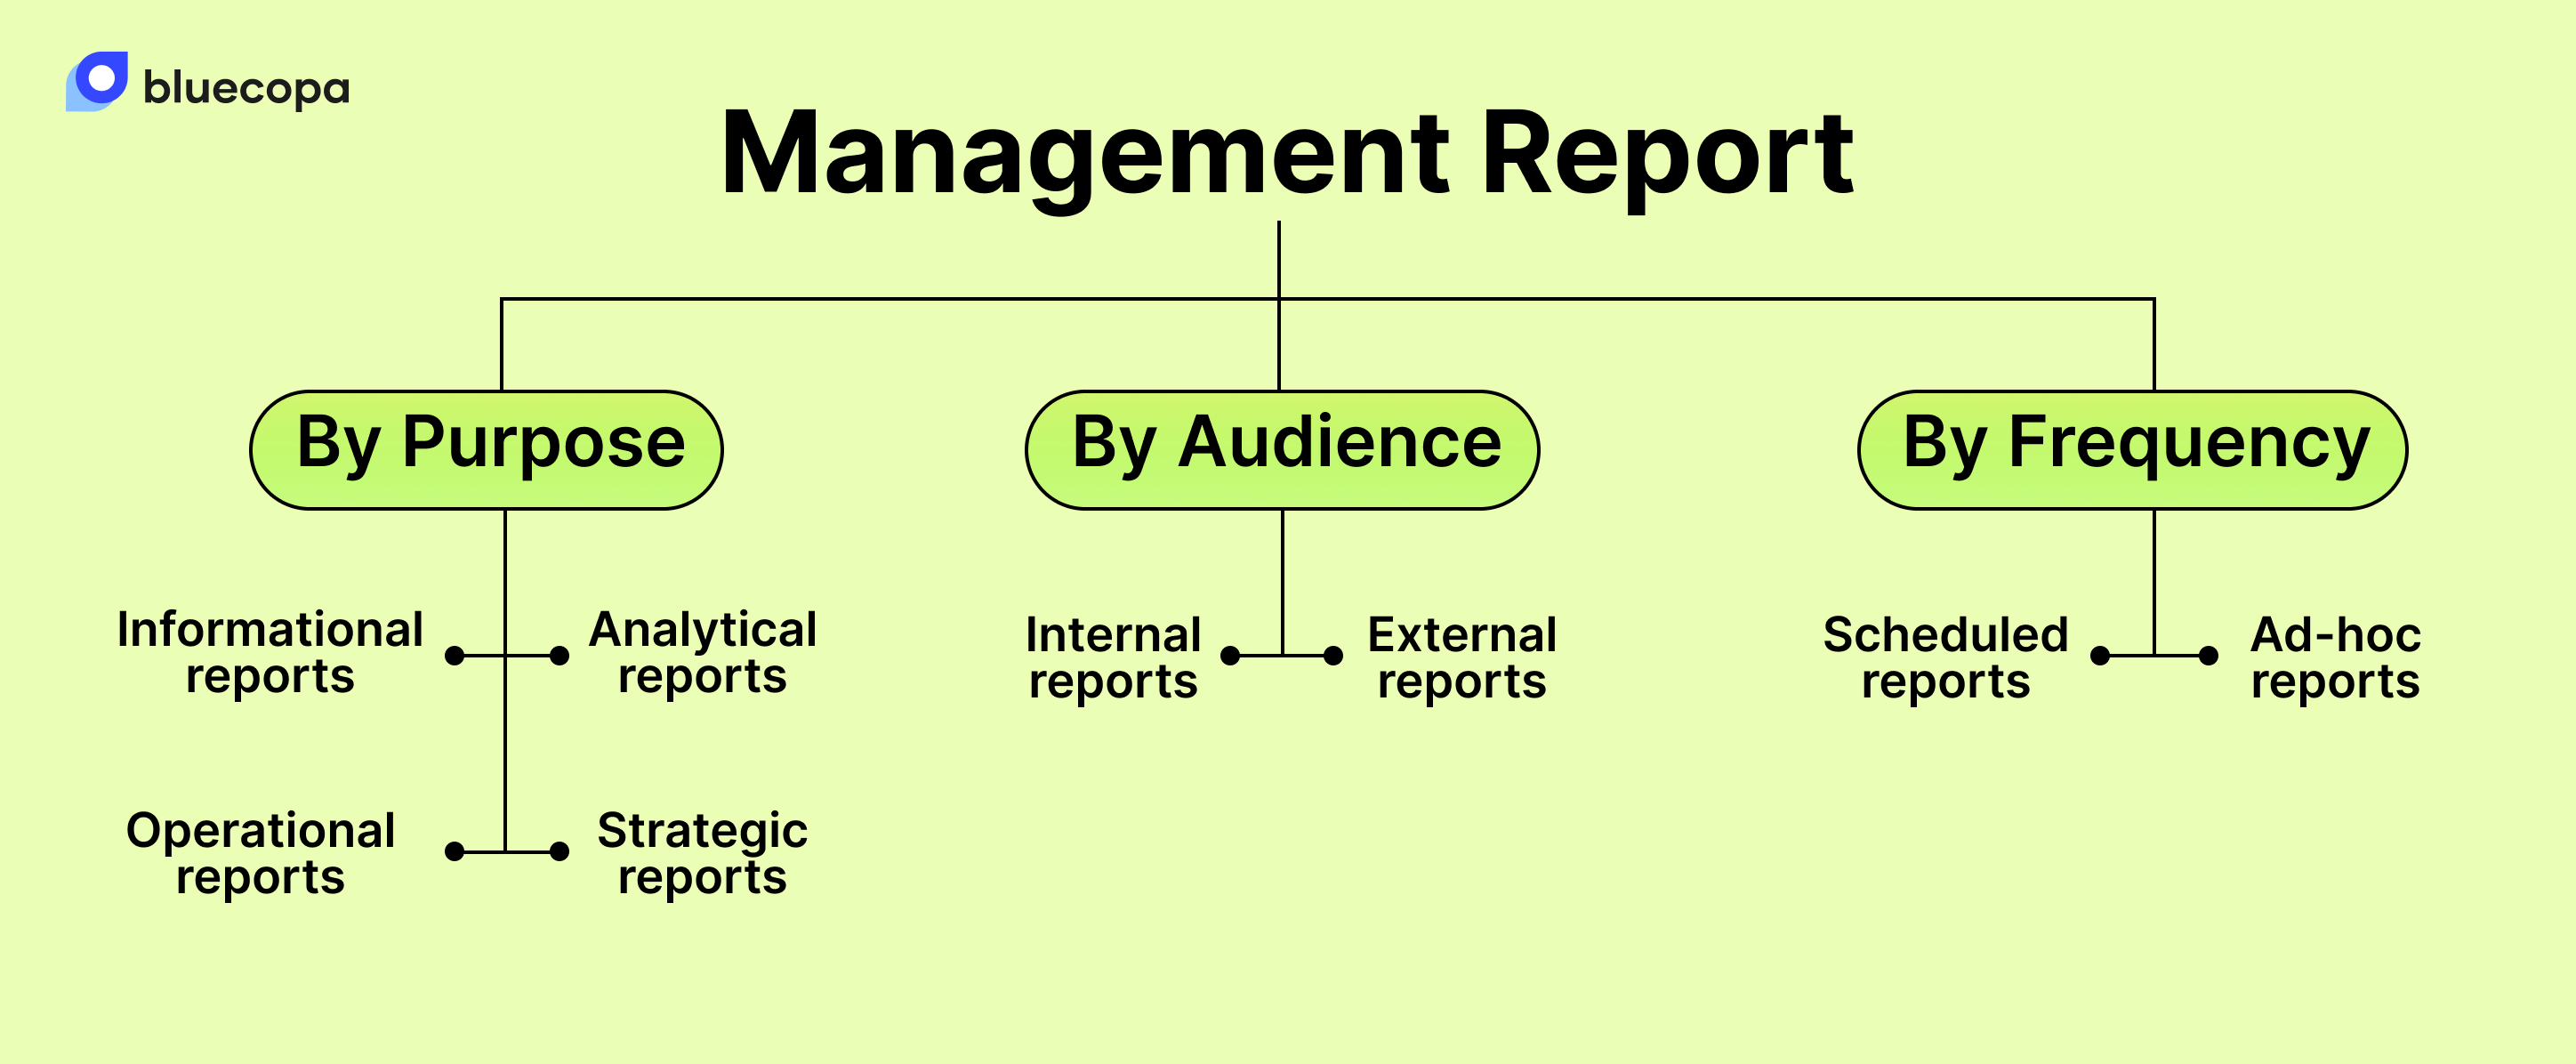
What are the types of management reports?
Here, let’s break down management reports into three buckets: by purpose, by audience, and by frequency.
A. By Purpose
1. Informational reports
These provide factual data and summaries on specific topics like performance metrics, expenses, or project progress.
Example - A monthly sales report detailing revenue generated by product category and region.
2. Analytical reports
These delve deeper, investigating data through trends, comparisons, and insights to explain performance and identify areas for improvement.
Example - A report analyzing customer churn reasons and recommending strategies to address them.
3. Operational reports
These track daily, weekly, or monthly performance for specific operational aspects like production efficiency, inventory levels, or customer service response times.
Example - A daily manufacturing report showing production output, line downtime, and quality control data.
4. Strategic reports
These assess progress toward long-term goals, evaluate the effectiveness of strategies, and identify potential risks or opportunities.
Example - A quarterly report analyzing market trends, competitor activity, and potential impacts on the company's strategic goals.
B. By Audience
1. Internal reports
These are designed for internal stakeholders like managers, executives, and teams, focusing on specific departments or projects.
Example - A financial report for the marketing team detailing campaign budgets and returns on investment.
2. External reports
These are prepared for external stakeholders like investors, creditors, and regulators, adhering to standardized formats and regulations.
Example - An annual financial report with audited statements for shareholders.
C. By Frequency
1. Scheduled reports
These are generated at regular intervals, like daily, weekly, monthly, or quarterly, based on data availability and decision-making cycles.
Example - Weekly inventory reports for production planning.
2. Ad-hoc reports
These are generated on demand to address specific needs or investigate unexpected events.
Example - A report analyzing the impact of a new marketing campaign on website traffic.
What are some challenges when creating management reports?
While these financial management reports are necessary, developing them is not an easy task. It has organizational, data, and reporting hurdles.
Firstly, data challenges can derail the entire management reporting process. Inaccurate or siloed data leads to misleading reports and poor decisions. Ensuring data quality and accessibility through effective collection, validation, and integration is crucial.
Secondly, reporting challenges can turn valuable data into wasted effort. Reports cluttered with information or lacking clear insights become overwhelming and lose their impact. Tailoring reports to specific audiences with actionable recommendations ensures their effectiveness.
Lastly, organizational challenges can hinder collaboration and implementation. Lack of clear objectives, limited resources, and resistance to change impede the creation of insightful reports. Fostering collaboration, defining goals upfront, and leveraging technology can overcome these obstacles.
What are some best practices for creating management reports?
#1 Start with a purpose
Firstly, focus on clarity and purpose. Before diving into data, define the exact objective and target audience for your report. Who needs this information, and what decisions will they make based on it? Knowing the why helps you gather relevant data and avoid overwhelming readers with unnecessary details.
💡 A clear objective acts as a guiding light, ensuring your report addresses the right questions and delivers actionable insights.
#2 Embrace storytelling
Transforming data into actionable financial stories is the second important aspect. Simply presenting raw numbers is not enough. The data should be analyzed for trends and compared with benchmarks, and the key drivers of success or bottlenecks should be identified. It's not sufficient to just display data; the story it tells needs to be uncovered. Highlighting actionable insights that empower stakeholders to make informed decisions on the spot is essential.
💡 It's important to remember that information without guidance is like a treasure map without an "X". It holds potential, but it's difficult to leverage.
#3 Keep your audience in mind
When creating reports, it's important to keep in mind the audience you're addressing. You should consider their level of knowledge and information requirements. For general users, it's best to avoid technical jargon and present information in a way that aligns with their decision-making context. Use charts and graphs to clarify the information and make it easy to understand.
💡 Remember that executives and frontline teams require different types of reports. Each audience is unique, so make sure you deliver the information in a way that resonates with them.
#4 Adopt tools and tech
Fourthly, it's important to utilize technology as a valuable aid in your data analysis. Tools such as Bluecopa can greatly reduce the workload of data collection, report generation, and collaboration, while simultaneously increasing accuracy. By using technology to handle the repetitive tasks associated with reporting, you can focus on analyzing and interpreting the data to gain valuable insights.
💡 Having tools is like having a reliable assistant who can take care of the tedious tasks, freeing up your time and energy to concentrate on the strategic aspects of your report.
#5 Vouch for clean data
Ensure accuracy and consistency of data across all sources. Inaccurate or inconsistent data can lead to erroneous conclusions and poor decision-making. Data quality should be treated as the foundation of your building; a weak foundation will result in an unstable report.
💡 Invest in data cleaning and validation processes to ensure that your insights are based on a reliable and robust foundation.
Creating management reports with Bluecopa
Bluecopa is a next-generation strategic finance tool that empowers finance teams to streamline the process of creating management reports. Here's how:
Data Integration and Automation
📍 Centralized platform: Bluecopa centralizes data from various sources like ERP, CRM, and HR systems, eliminating the need for manual data extraction and reconciliation. This ensures data accuracy and consistency and saves time.
📍 Automated data collection and transformation: Bluecopa automates data collection and transformation tasks, reducing manual effort and minimizing errors. This frees up valuable time for finance teams to focus on analysis and insights.
Streamlined Reporting and Visualization
📍 Pre-built templates and dashboards: Bluecopa offers a library of pre-built templates and dashboards for common reports like financial statements, operational reports, and KPI dashboards. This saves time and ensures consistency in report formatting.
📍 Real-time data visualization: Bluecopa enables real-time data visualization, providing finance teams with up-to-date insights to make informed decisions quickly.
So, don’t hesitate to create insightful managerial reports with Bluecopa. Request a personalized demo to get started.
Further reads
You might also enjoy reading
The Complete Guide To Month-End Reporting [With Helpful Checklist]