


Managing accounts payable has become more critical than ever. Effective management of this critical function can impact financial health, cash flow, and overall efficiency. And the key to staying on top of accounts payable lies in monitoring and tracking the right Key Performance Indicators (KPIs).
Accounts Payable KPIs are a set of metrics that provide valuable insights into the performance and effectiveness of the accounts payable process. By monitoring these KPIs, teams gain a deep understanding of their financial position, identify potential bottlenecks, and proactively address payment-related issues.
But why should you monitor accounts payable KPIs? The answer lies in the immense benefits it brings.
First and foremost, monitoring accounts payable KPIs allows you to optimize cash flow management. By keeping a close eye on metrics such as Days Payable Outstanding (DPO) or Cash Conversion Cycle (CCC), you can ensure timely payments to vendors and suppliers, maintain good relationships, and potentially negotiate better terms. This, in turn, helps secure discounts, avoid late payment penalties, and improve overall financial stability.
In addition, tracking KPIs related to invoice accuracy and processing time enables you to identify inefficiencies in your accounts payable process. Metrics like Invoice Processing Cycle Time or Accuracy Rate provide real-time insights into bottlenecks, redundancies, and potential risks. By addressing these issues promptly, you can streamline processes, increase productivity, and reduce the risk of errors, which ultimately leads to more cost-effective operations.
Furthermore, monitoring accounts payable KPIs helps you gain visibility into your spending patterns and manage vendor relationships effectively. Metrics such as Spend Under Management, Vendor Performance, or Purchase Order Compliance shed light on your purchasing habits, highlighting opportunities to consolidate vendors, negotiate better pricing, and ultimately reduce costs. By leveraging these insights, you can make strategic decisions, allocate resources efficiently, and foster long-term partnerships with suppliers.
In this blog, we will look into the best accounts payable KPIs and the reasons behind their importance. We will discuss best practices for tracking these KPIs, leveraging tech and automation to streamline processes.
What are accounts payable (AP) KPIs?
Accounts payable KPIs are like dashboard gauges for your financial health when managing vendor payments. These metrics help you understand how efficient and effective your AP process is. Tracking AP KPIs often results in improved performance and optimized workflows.
What are the challenges AP KPIs solve?
AP KPIs help business teams manage vendor relationships and manage liquidity. Regarding pain points that AP KPIs cure, it fixes inefficiencies and risks. It also renders a good amount of cost savings for your AP teams. Now, let’s delve into these buckets—
.avif)
Why are AP KPIs important?
Metrics always help AP teams to understand and verify whether their progress is aligned with overall business goals. Moreover, AP teams work cross-functionally - any mistake could create a ripple effect.
Some essential reasons for tracking them include —
- Identify process bottlenecks: KPIs point out slow processing times, high touchless invoice rates, and inefficient resource allocation, highlighting areas for automation and streamlining workflows.
- Reduce costs: By identifying and addressing inefficiencies, you can significantly decrease costs associated with invoice processing, manual work, and errors.
- Negotiate better deals: Understanding per-vendor spending patterns helps you identify key suppliers and potential cost savings through negotiations.
- Improve credit standing: Maintaining prompt payments and positive relationships with vendors ensures good credit standing, potentially leading to better borrowing terms and conditions.
- Stronger supplier relationships: Positive relationships with vendors can lead to preferential treatment, better pricing, and early access to new products or services.
10 AP KPIs with Formula, Definition, Example, and Impact
1. Days Payable Outstanding (DPO)
DPO is the average number of days it takes a company to pay its suppliers after invoices are due. You can calculate DPO using the formula below —
DPO = (Average accounts payable * 365) / Total purchases on credit
Example
If your average accounts payable is $10,000 and your total purchases on credit in a year are $100,000, your DPO is (10,000 * 365) / 100,000 = 36.5 days.
Impact
💡 Low DPO: Indicates faster payments, potentially leading to better supplier relationships, early payment discounts, and improved cash flow.
💡 High DPO: Can signal slow processing, delayed payments, potential compliance issues, and damage to supplier relationships.
2. Cost per Invoice Processed
Cost per invoice processed is the average cost associated with processing a single invoice, including labor, technology, and other expenses. You can calculate it using the formula below —
Cost per invoice processed = Total AP processing costs / Number of invoices processed
Example
If your total AP processing costs are $5,000 per month and you process 500 invoices, your cost per invoice is $5,000 / 500 = $10.
Impact
💡 Low cost: Suggests efficient automation, streamlined workflows, and reduced manual work, leading to cost savings.
💡 High cost: Indicates potential inefficiencies, excessive manual work, or outdated technology, requiring process improvement and automation.
3. Invoices Processed per Employee
This AP metric can be defined as the average number of invoices processed by each employee in a specific period. You can calculate it using the below formula —
Invoices processed per employee = Number of invoices processed / Number of AP employees
Example
If your team processes 2,000 invoices per month with 5 employees, your invoices per employee are 2,000 / 5 = 400 per month.
Impact
💡 High number: Indicates high individual and team productivity, suggesting efficient training, clear workflows, and potential automation.
💡 Low number: May point to inefficiencies, lack of training, or insufficient resources, requiring process improvement or additional staff.
4. Percentage of Invoices Processed Straight Through
This AP metric is defined as the percentage of invoices processed electronically without requiring manual intervention. You can calculate it using the below formula —
% of invoices processed straight through = (Number of invoices processed without exceptions / Total number of invoices) * 100%
Example
If your team processes 200 invoices with 20 requiring manual intervention, your straight-through processing rate is (180 / 200) * 100% = 90%.
Impact
💡 High percentage: Indicates efficient automation, clear data, and minimal errors, suggesting process optimization and data quality.
💡 Low percentage: Points to data inconsistencies, manual intervention needs, or potential automation issues, requiring data cleaning and workflow adjustments.
5. Early Discount Capture Rate
The early discount capture rate is the percentage of discounts captured by paying supplier invoices early. You can calculate it using the below formula —
Early discount capture rate = (Amount of early discounts captured / Total potential early discounts) * 100%
Example
If you captured $1,000 in early payment discounts with a total potential of $2,000, your capture rate is ($1,000 / $2,000) * 100% = 50%.
Impact
💡 High rate: Indicates effective cash flow management and proactive payment practices, leading to cost savings and improved financial health.
💡 Low rate: Suggests missed opportunities for cost savings, potentially due to inefficient workflows, late payments, or lack of awareness of discounts.
6. Percentage of Late Payments
This metric can be defined as the percentage of invoices paid after the due date.
% of late payments = (Number of late payments / Total number of invoices) * 100%
Example
If you have 10 late payments out of 200 invoices, your late payment rate is (10 / 200) * 100% = 5%.
Impact
💡 Low rate: Indicates timely payments, good supplier relationships, and compliance with terms, minimizing potential penalties and risks.
💡 High rate: This can signify cash flow issues, inefficient processes, or poor supplier communication, leading to compliance risks, damaged relationships, and potential late fees.
7. Accounts Payable Turnover Ratio
The accounts payable turnover ratio measures how efficiently a company pays its suppliers by calculating how often accounts payable are turned over within a period.
AP Turnover Ratio = Total purchases on credit / Average accounts payable
Example
With $100,000 in purchases and $20,000 in average accounts payable, the turnover ratio is $100,000 / $20,000 = 5 times per year.
Impact
💡 High ratio: Indicates faster payments, efficient use of credit, and potentially improved supplier relationships.
💡 Low ratio: Suggests slow payments, potential cash flow issues, or inefficient use of credit lines.
8. Average Approval Time for Invoices
This metric tracks the average time it takes for invoices to be approved before payment. You can calculate it using the below formula —
Average approval time for invoices = (Total approval time for all invoices / Number of invoices) / Number of approval steps
Example
If 200 invoices take 3 days each for approval with 2 steps, the average approval time is (200 invoices * 3 days) / (200 invoices * 2 steps) = 1.5 days per step.
Impact
💡 Short time: Indicates efficient approval processes, potentially leading to faster payments and improved supplier satisfaction.
💡 Long time: Suggests bottlenecks or inefficiencies in the approval process, delaying payments and potentially harming relationships.
9. Vendor Satisfaction Score
Vendor satisfaction score measures the satisfaction level of your suppliers through surveys or feedback mechanisms. The formula varies based on the chosen metric (e.g., the average score on a feedback survey)
Example
If your vendor satisfaction score is 80% on a 100-point scale, it indicates good relationships and overall satisfaction.
Impact
💡 High score: This signifies positive supplier relationships, potentially leading to better prices, terms, and early payment discounts.
💡 Low score: Suggests issues with payment timelines, communication, or dispute resolution, requiring improvement.
10. Percentage of Invoices with Disputes
This metric tracks the percentage of invoices requiring clarification or dispute resolution before payment.
% of invoices with disputes = (Number of disputed invoices / Total number of invoices) * 100%
Example
If you have 5 disputes out of 200 invoices, your dispute rate is (5 / 200) * 100% = 2.5%.
Impact
💡 Low rate: Indicates accurate data, clear communication with suppliers, and efficient dispute resolution processes.
💡 High rate: Suggests potential data inconsistencies, communication issues, or inefficient dispute resolution processes, leading to delays and supplier dissatisfaction.
What are some best practices for effectively tracking AP KPIs?
Effective AP KPI monitoring is an ongoing exercise. Below, we have listed some best practices for doing so —
#1 Define clear goals and select relevant KPIs
✅ Start with your goals: Identify your key objectives for accounts payable, such as reducing processing costs, improving payment times, or strengthening supplier relationships.
✅ Choose relevant KPIs: Select metrics that directly align with your goals and provide actionable insights. Don't overload yourself with too many KPIs.
✅ Consider industry benchmarks: Research industry averages for your chosen KPIs to understand your performance relative to peers.
#2 Establish measurement and tracking systems
✅ Automate data collection: Utilize technology to automatically gather data from your accounting system for relevant KPIs.
✅ Set clear targets: Define performance targets for each KPI based on your goals and industry benchmarks.
✅ Regularly monitor progress: Schedule regular review periods (e.g., weekly, monthly) to analyze KPI trends and identify areas for improvement.
#3 Leverage visualization and reporting
✅ Visualize your data: Utilize charts, graphs, and dashboards to present KPI data in a clear and easily digestible format.
✅ Create detailed reports: Generate reports that analyze trends, compare performance against targets, and highlight areas requiring attention.
✅ Share reports with stakeholders: Communicate KPI findings to relevant teams (e.g., finance, purchasing) to promote collaboration and drive improvement initiatives.
#4 Take action and continuously improve
✅ Investigate deviations: When KPIs deviate significantly from targets, investigate the root causes and implement corrective actions.
✅ Refine your KPIs: Regularly evaluate the effectiveness of your chosen metrics and adjust them as needed to best reflect your evolving goals and priorities.
✅ Invest in continuous improvement: Seek opportunities to automate processes, streamline workflows, and leverage technology to further enhance your AP efficiency.
Measure your AP KPIs with Bluecopa
Bluecopa automates the data collection and calculation, removing manual tasks and ensuring accuracy. You get valuable insights without the hassle, freeing up time for analysis and strategic action.
Majorly, it helps in three ways —
Accurate data foundation
Effective decision-making hinges on reliable data. Bluecopa tackles this by automating error-prone AP tasks, starting with invoice processing. Imagine invoices automatically extracted, fields populated, and workflows guiding approvals straight to the right people. This reduces manual data entry, ensuring accuracy and centralizing invoice information.
Effortless metric generation
Forget manual calculations! Metrics like monthly invoice volume, average accounts payable, and manual intervention rates are readily available. Analyze them using spreadsheets or, better yet, leverage Bluecopa's dashboards to visualize calculated KPIs automatically.
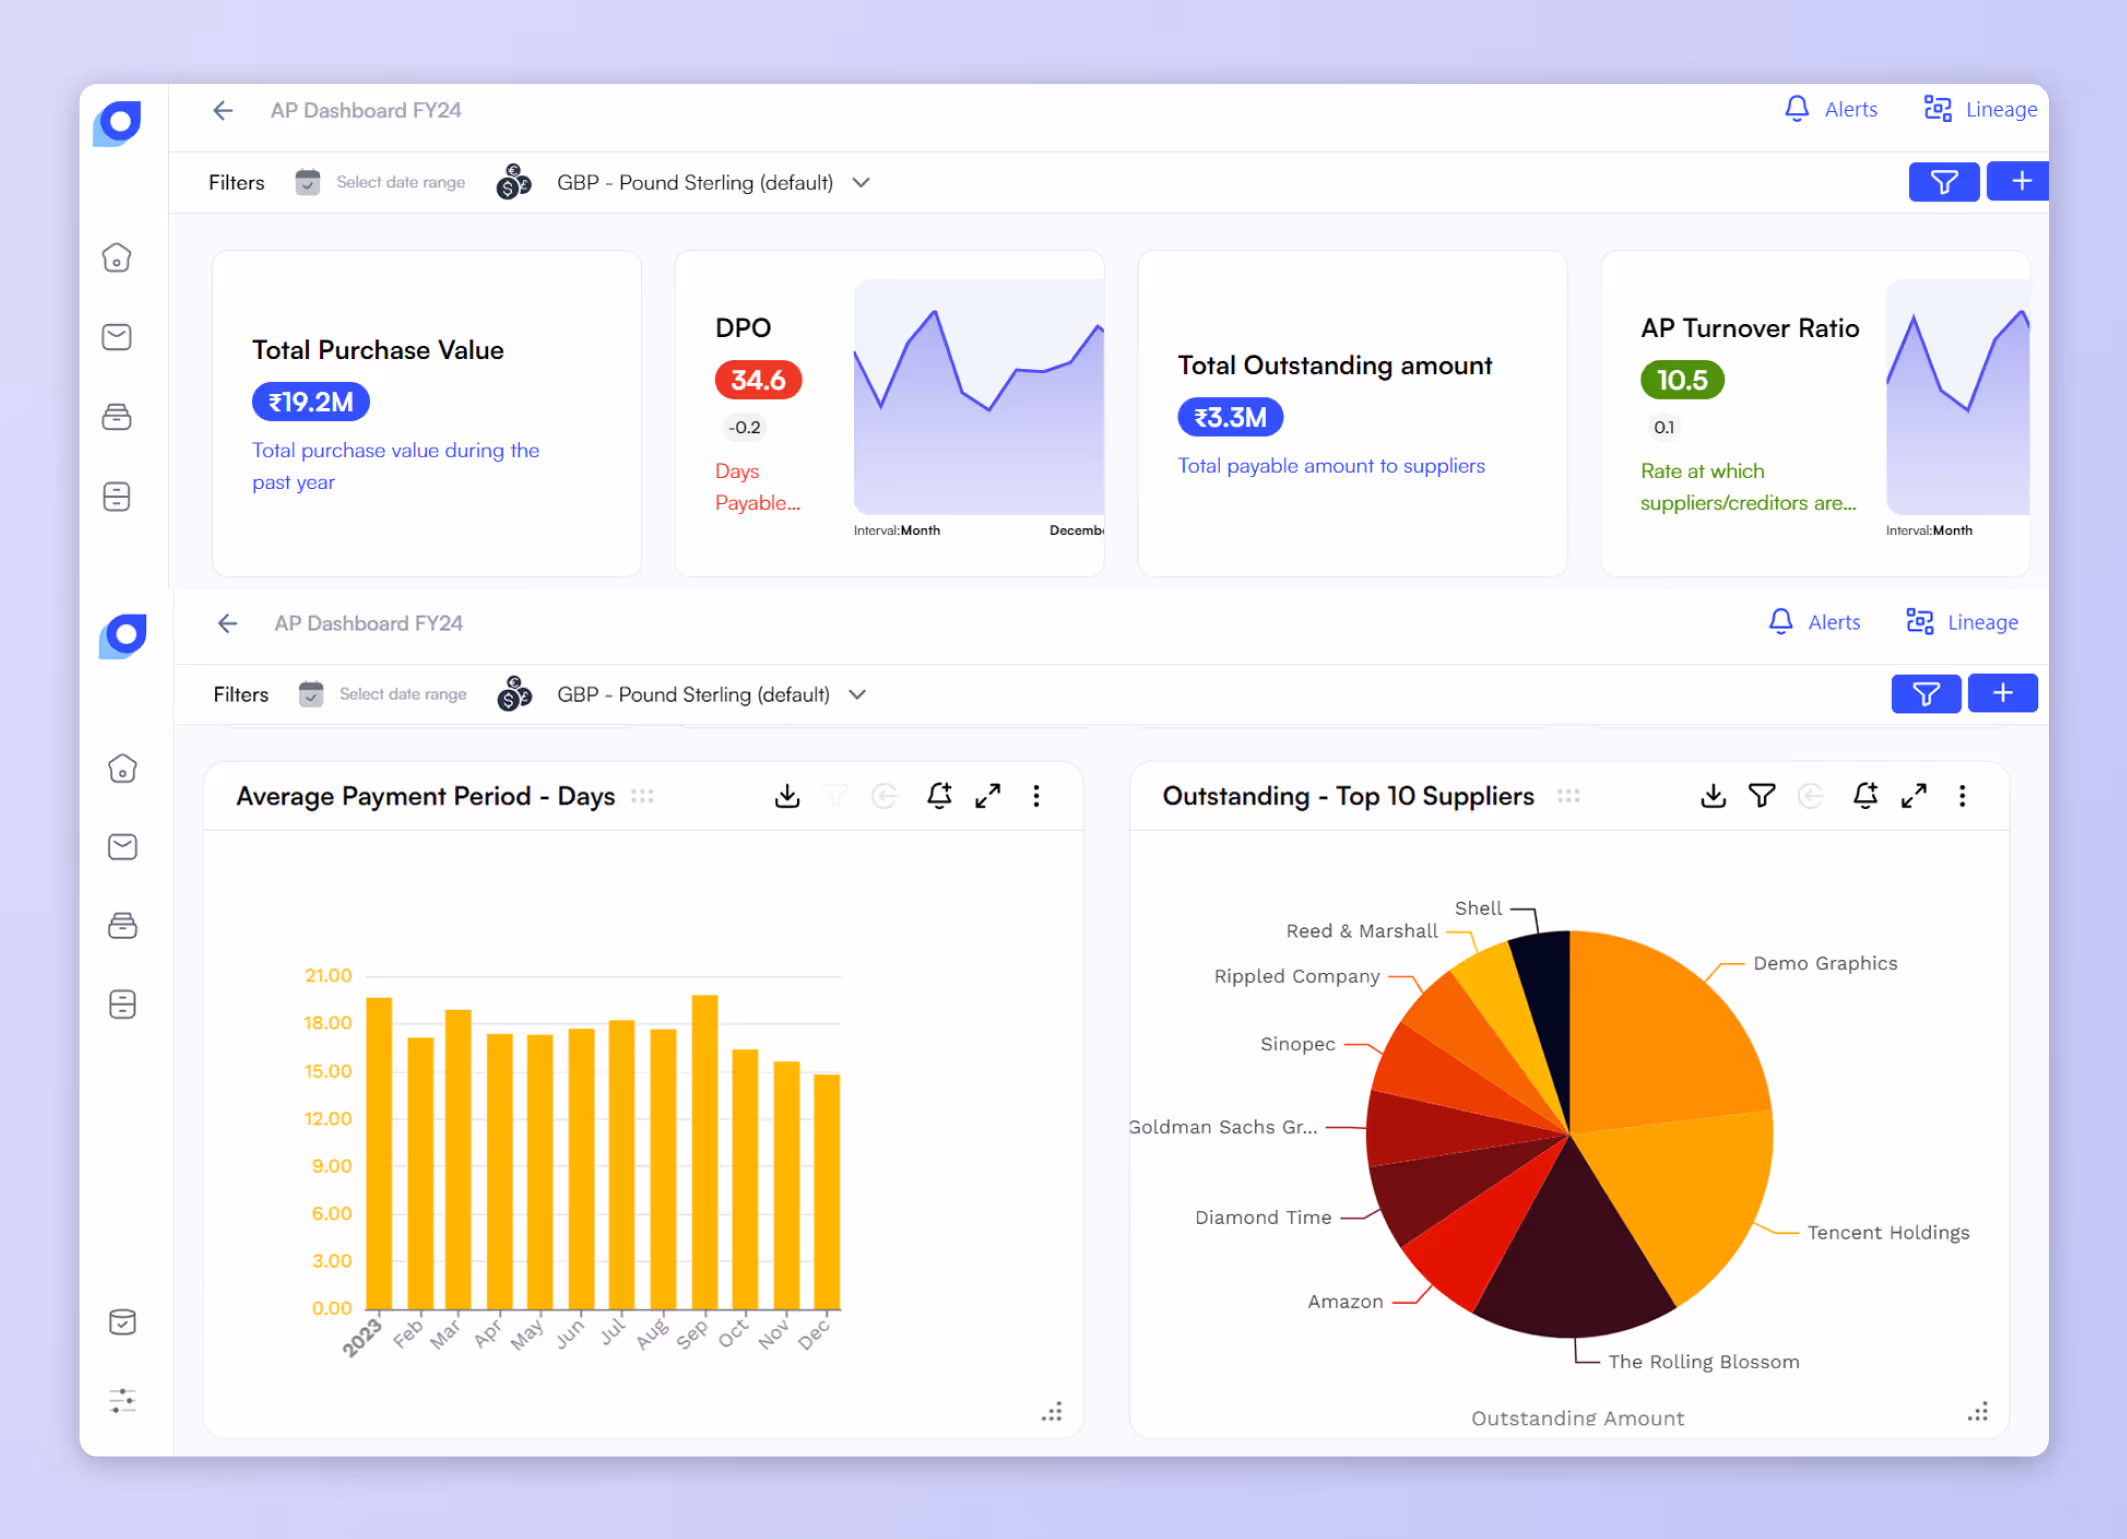
Intuitive dashboards for informed decisions
Move away from the data digging. Bluecopa presents pre-defined and customizable dashboards displaying key AP KPIs in real time. No more hunting for data, just clear insights at your fingertips, empowering you to make informed business decisions instantly.
To bring in AP automation and start monitoring the above KPIs, drop by and get a personalized demo.