


%20KPIs%20AR%20Teams%20Must%20Track.png)
For accounting teams, managing accounts receivable has traditionally meant drowning in spreadsheets, chasing late payments, and stitching together cash flow projections from lagging data. Manual reconciliation work consumes hours that could be spent on analysis, while delayed visibility forces finance leaders to react after cash flow damage is already done. This is precisely why diligent accounts receivable KPI monitoring became essential.
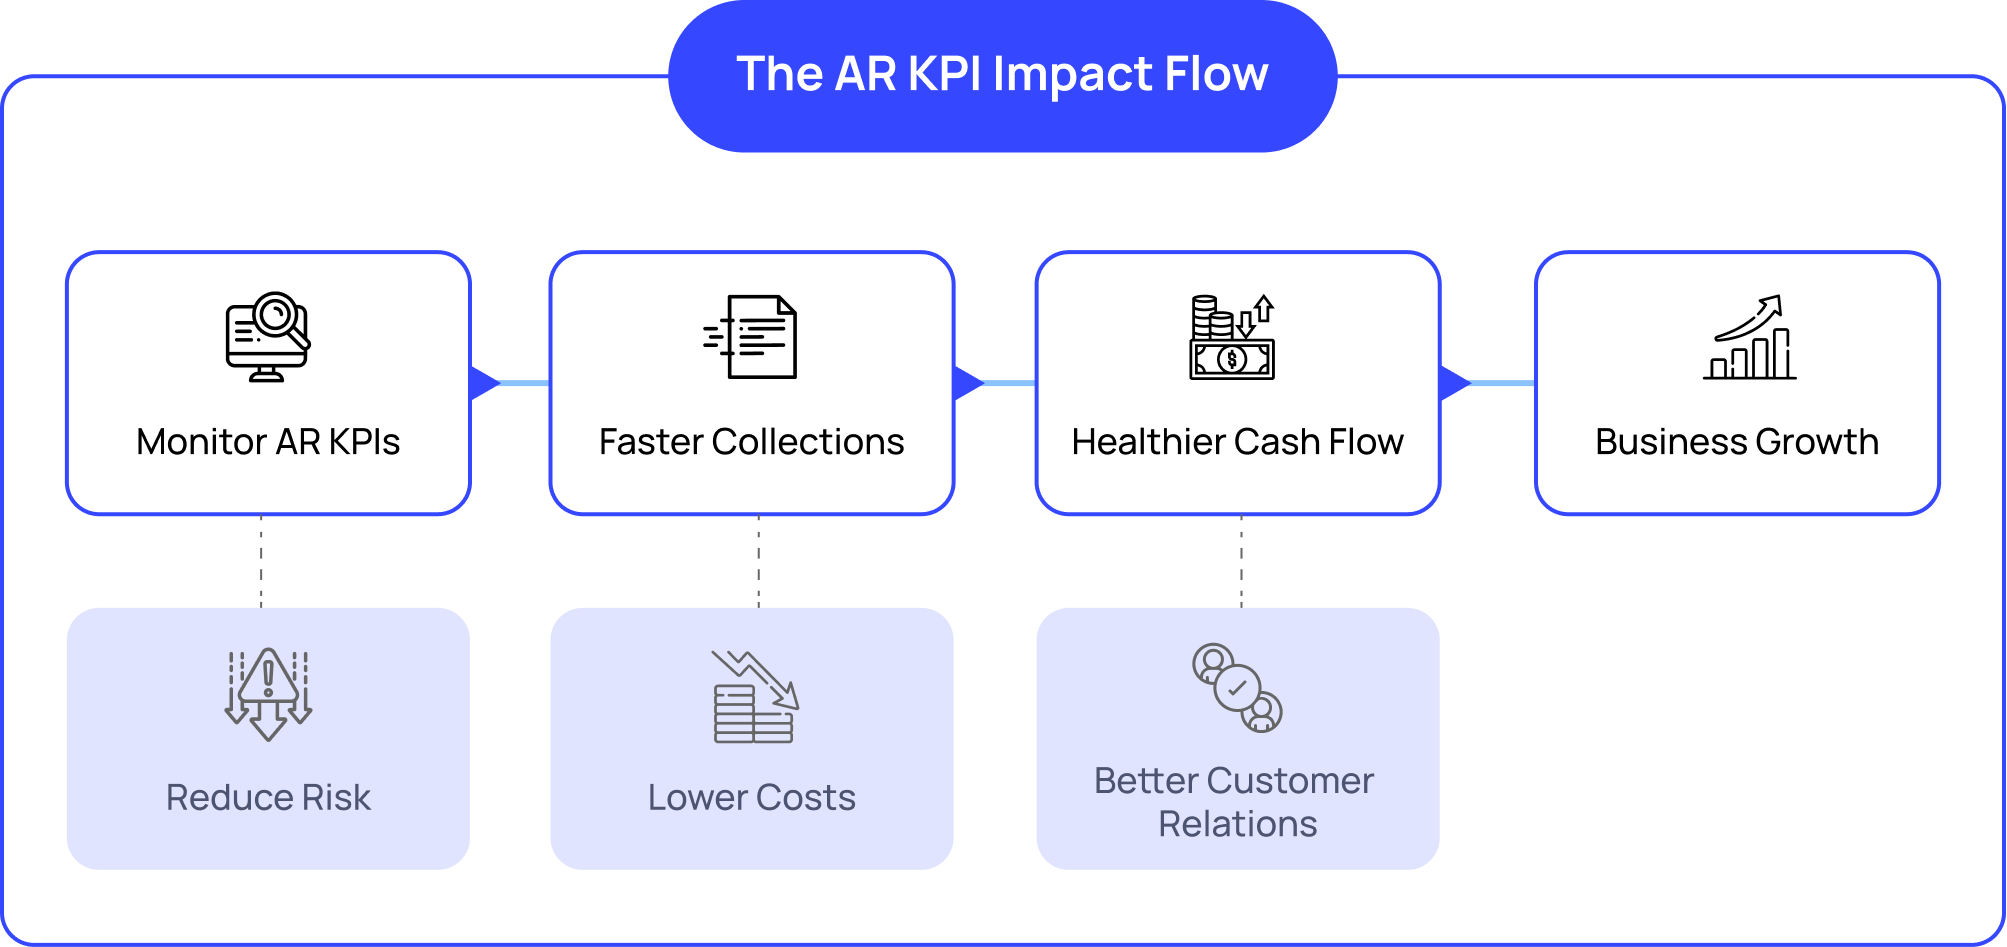
Today, as the AR operations shift from manual to automated and now to autonomous, tracking these KPIs isn't just about managing collections; it's about enabling AI-powered decision-making that drives sustainable business growth.
The autonomous systems need continuous feedback loops to improve. Hence, every KPI becomes a training signal. When your DSO improves, the ML model learns which strategies worked. This creates a compounding advantage, where autonomous finance teams get smarter every month while manual teams plateau.
Why AR KPI Tracking Looks Different Today
Accounts receivable tracking is the practice of monitoring cash tied up in unpaid invoices. What changed in 2026 is not the accounts receivable KPIs list; it’s how they are used.
Modern finance teams operate with a predict-and-prevent mindset. Instead of reviewing AR weekly or monthly, systems continuously evaluate risk, prioritize work, and execute routine actions without human intervention.
How AI Makes AR KPIs Actionable
- Predictive DSO forecasting: Machine learning models analyze customer-level payment behavior, seasonality, contract terms, and dispute history to predict which invoices will miss due dates, before they do.
- Smart collection prioritization: Instead of chasing the oldest invoices, AI ranks accounts by recovery probability and cash impact.
- NLP-driven dispute detection: AI reads customer emails and ticket notes to identify dispute signals early, reducing back-and-forth and delayed payments.
- Autonomous workflows: Reminder emails, escalations, tolerance handling, and anomaly flags run automatically, with humans stepping in only for exceptions.
The 10 Most Critical AR KPIs
Modern teams track AR KPIs across four dimensions to maintain continuous visibility and enable automated intervention.
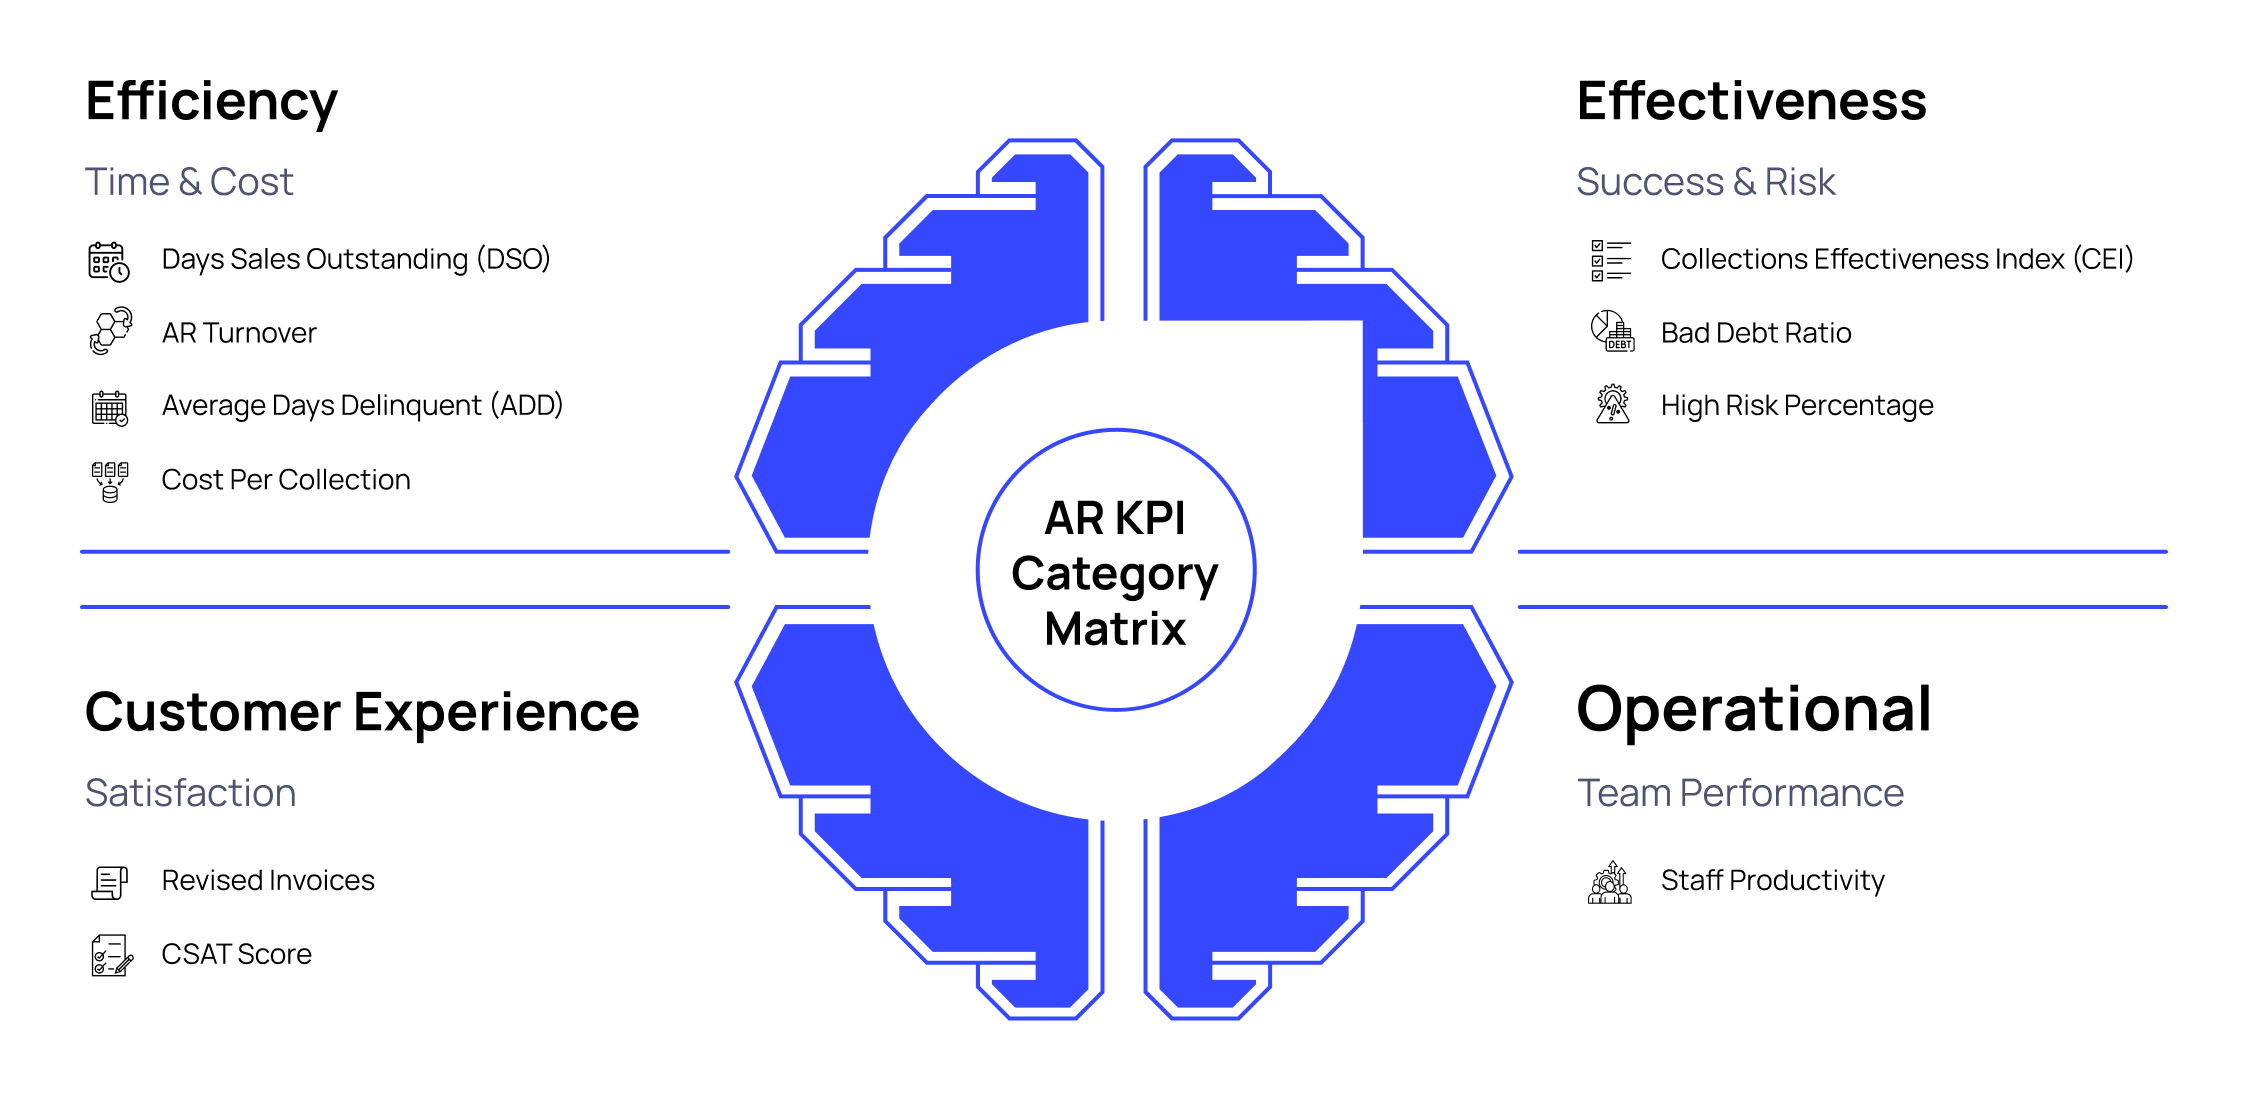
EFFICIENCY METRICS
1. Days Sales Outstanding (DSO)
DSO = (Average AR / Total Credit Sales) × Days in Period
DSO is a lagging indicator. By the time it spikes, damage is done. Today, finance teams need to monitor DSO daily by customer segment, not company-wide averages. If DSO increases 3+ days week-over-week, run cohort analysis like: is this seasonal, or has the behavior changed?
Insight: Leading teams track "Predicted DSO" (where DSO will be in 30 days based on current aging) rather than historical DSO. This shift from reactive to predictive is the autonomous advantage.
2. AR Turnover Ratio
AR Turnover = Total Credit Sales / Average AR
High AR turnover through aggressive collections can upset customers. Hence, context matters. Finance teams need to understand where they need to optimize for sustainable pace, not maximum speed, and ensure customer satisfaction.
3. Average Days Delinquent (ADD)
ADD = DSO - Best Possible Days Outstanding
Many finance teams don't track ADD separately from DSO. They need to understand that DSO can look acceptable while ADD can reveal serious issues masked by early payers.
Insight: ADD above 10 days requires automated reminder sequences starting at day 5 past due.
4. Operational Cost Per Collection
Cost Per Collection = Total AR Operating Expenses / Total Amount Collected
The assumption is that the cost per collection metric should decrease with automation, but many see it increase because they're running dual systems, and adding automation without actually eliminating manual tasks can hinder this metric.
EFFECTIVENESS METRICS
5. Collections Effectiveness Index (CEI)
CEI = [(Beginning AR + Credit Sales - Ending AR) / (Beginning AR + Credit Sales - Ending Current AR)] × 100
Most finance teams track CEI monthly. But, autonomous systems track it daily by customer cohort, revealing patterns invisible in monthly aggregates.
Insight: Leading teams track "Predicted CEI" for in-flight invoices. If the current cohort's predicted CEI is 82%, the system escalates collection efforts before the month-end.
6. Bad Debt to Sales Ratio
Bad Debt Ratio = Uncollectible Receivables / Total Sales
Bad debt is viewed as inevitable. In reality, 60-70% of bad debt is predictable 60+ days before write-off. Autonomous teams prevent it; manual teams write it off.
Insight: A bad debt ratio above 2% requires immediate credit criteria tightening.
7. Percentage of High-Risk Accounts
High-Risk % = (High-Risk AR Balance / Total AR Balance) × 100
Most finance teams use static criteria ("30+ days past due = high risk"). Autonomous systems use dynamic risk scoring that updates daily based on payment behavior, industry news, credit changes, and macroeconomic indicators.
CUSTOMER EXPERIENCE METRICS
8. Number of Revised Invoices
Revised Invoice Rate = Revised Invoices / Total Invoices Issued
Many finance teams don't track this KPI at all, and treat revisions as "normal." Every revised invoice delays payment 7-14 days on average and frustrates customers.
Insight: AI systems validate invoices pre-issuance by comparing them to contract terms, PO numbers, and delivery confirmations. This catches 80% of errors before customers see them.
9. Customer Satisfaction (CSAT) Score
Measured through post-interaction surveys or feedback tools
Most AR teams don't measure CSAT, assuming it's a "sales problem." But, finance teams need to recognize that AR interactions can affect retention. A study found 34% of B2B customers cite "billing and payment issues" as a top switching reason.
Insight: CSAT below 80% requires review of collection communication tone and frequency.
OPERATIONAL METRICS
10. Staff Productivity
Staff Productivity = (Total Amount Collected / Number of AR Team Members) / Period
High productivity through overwork isn't sustainable. The modern finance standard is high productivity through automation. The new metric is "strategic hours percentage," which highlights the time spent on judgment calls versus data entry.
Insight: Autonomous teams target 70%+ strategic hours; manual teams average 20-30%.
11. Touchless Collections Rate
Touchless Collections Rate = (Invoices Cleared Automatically / Total Invoices Issued) × 100
This metric indicates how effectively AI-driven workflows, smart reminders, and automated dispute handling are working. A low touchless rate signals over-reliance on manual effort, while a rising rate reflects scalable, cost-efficient AR operations.
Insight: If the touchless rate stagnates, finance teams should automate reminders, standardize billing data, and eliminate recurring invoice errors upstream.
Getting Started: 3-Step Framework
- Establish Baselines: Calculate your current performance across all 10 KPIs. Use the past 3-6 months of data to establish reliable benchmarks.
- Set Realistic Targets: Compare your baselines to industry standards and set achievable improvement goals. Prioritize the 3-4 KPIs with the greatest impact on your cash flow.
- Automate Monitoring: Implement real-time tracking through AR automation platforms. Set up alerts for critical thresholds to address issues before they escalate.
Conclusion
You don't need to accept slow collections, unpredictable cash flow, and frustrated customers as the cost of doing business. Many modern finance teams using Bluecopa have achieved remarkable results, including 12-day reductions in DSO, 18% improvements in collection rates, and higher CSAT scores through automated workflows and faster issue resolution.
Our AI-powered platform eliminates manual tracking, delivers predictive insights, and provides real-time KPI visibility, transforming AR from a reactive cost center into a proactive revenue driver.
Book a personalized demo to see your potential impact.