


Most e-commerce finance teams already track the right financial metrics, including Net Revenue, AOV, GMR, and more.
But the problem isn't what you're tracking, it's how!
Many e-commerce finance teams still rely on reports that explain what happened days or weeks later when revenue leakage, margin erosion, or customer churn has already occurred. This is just reporting numbers and doesn’t drive growth, efficiency, or profitability.
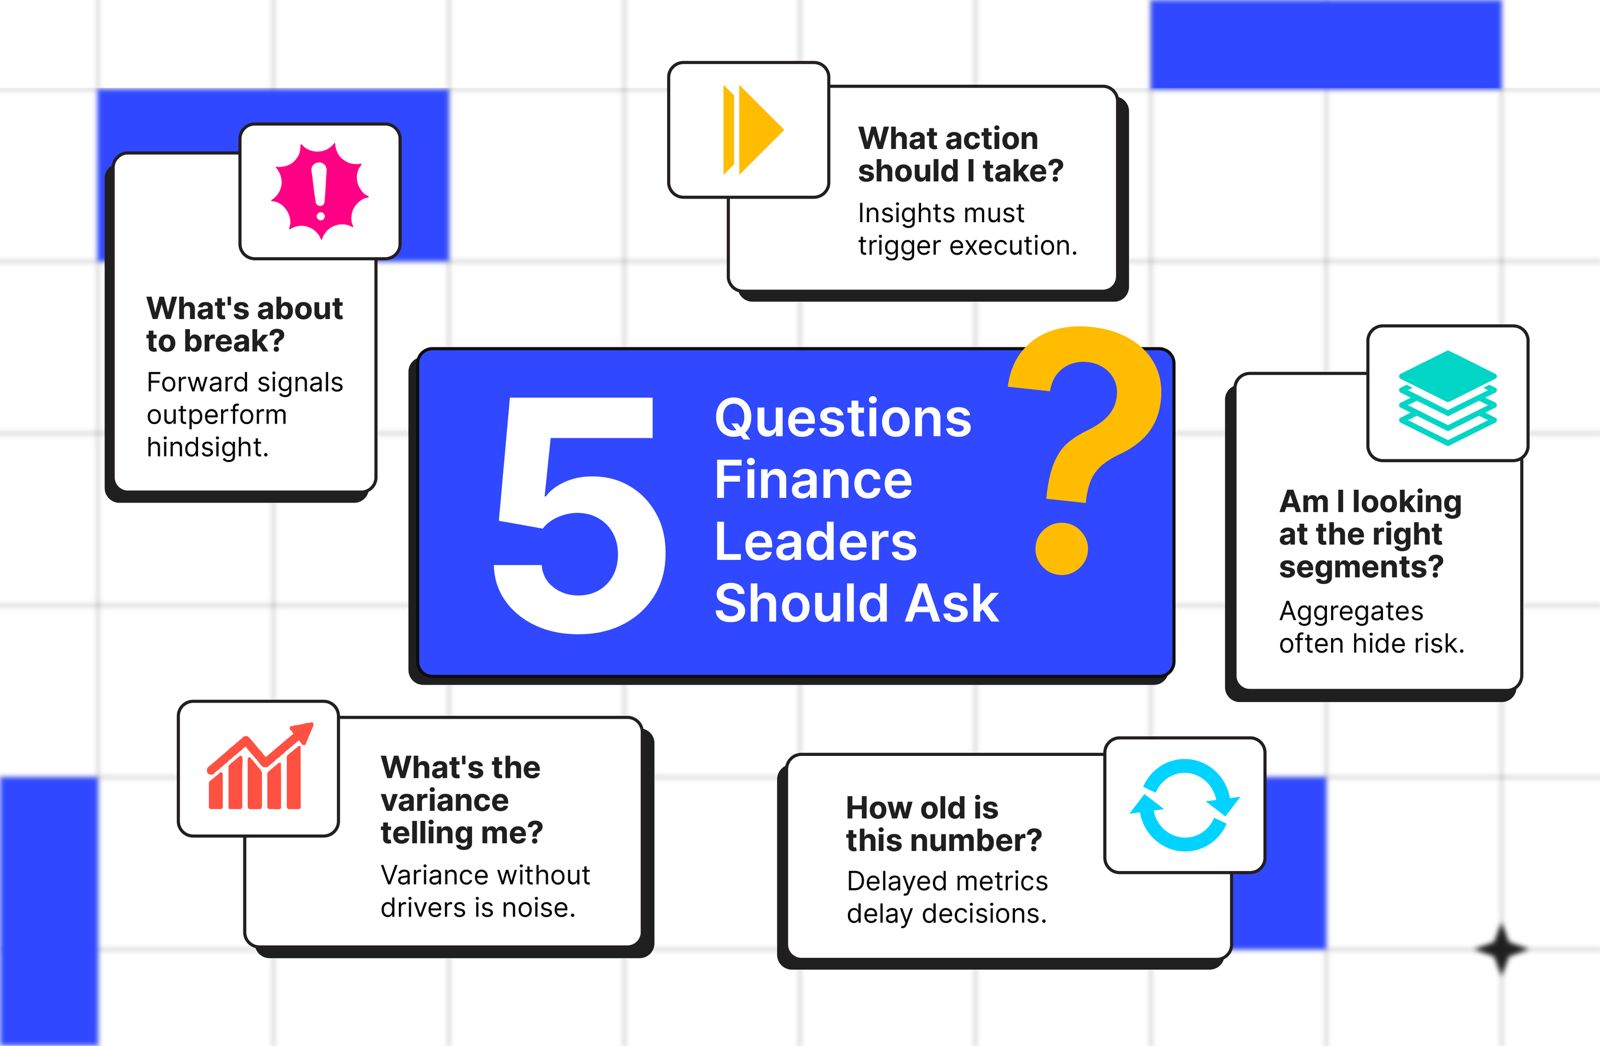
AI is changing how financial metrics function. Instead of acting as scorecards, they are becoming early warning systems that highlight risks, predict outcomes, and recommend action.
Why Traditional Financial Metrics Tracking Falls Short
Today, an e-commerce finance leader is still pulling the metrics data from systems that update overnight, reconcile manually, and surface problems after they've already cost you money. And this isn’t sufficient.
The gaps in traditional tracking:
- Lag Time Limits Action: Weekly reports surface problems after revenue has leaked. By the time margin erosion appears in dashboards, hundreds of unprofitable orders have already been processed.
- Metrics Without Context: Revenue dropped 8%. Why? Was it discount abuse, inventory mix, or seasonality? Traditional dashboards show outcomes without drivers or recommended actions.
- Manual Reconciliation Creates Delays: Finance teams spend 40% of their time reconciling data across platforms. By the time numbers are clean, they're stale.
- Static Benchmarks Miss Nuance: Your 42% GMR looks healthy, but is that good for your product mix, seasonality, and target margins? Aggregate metrics hide segment-level realities.
How AI Changes Financial Metrics
Traditional reporting answers one question: What happened?
AI-driven analytics expands that into three: What is happening? What will happen next? What should we do about it?
AI transforms metrics in three major ways:
- From Reporting to Prediction
Instead of reviewing last month’s revenue, finance leaders receive forward-looking forecasts tied to operational drivers such as inventory availability or customer demand shifts. - From Aggregates to Segments
AI reveals patterns hidden inside averages, allowing finance teams to detect revenue leakage or margin risk earlier. - From Manual to Continuous Intelligence
Automated data integration removes reconciliation delays and allows metrics to update continuously.
The 7 Financial Metrics That Matter And How AI Strengthens Them
1. Net Revenue (With Predictive Context)
Net revenue is often treated as a historical performance metric. AI converts it into a forward indicator.
Revenue may appear stable, but predictive modeling can highlight declining demand in specific product categories or margin pressure from promotional activity. Early visibility allows finance and operations teams to adjust pricing, promotions, or inventory strategy before targets are missed.
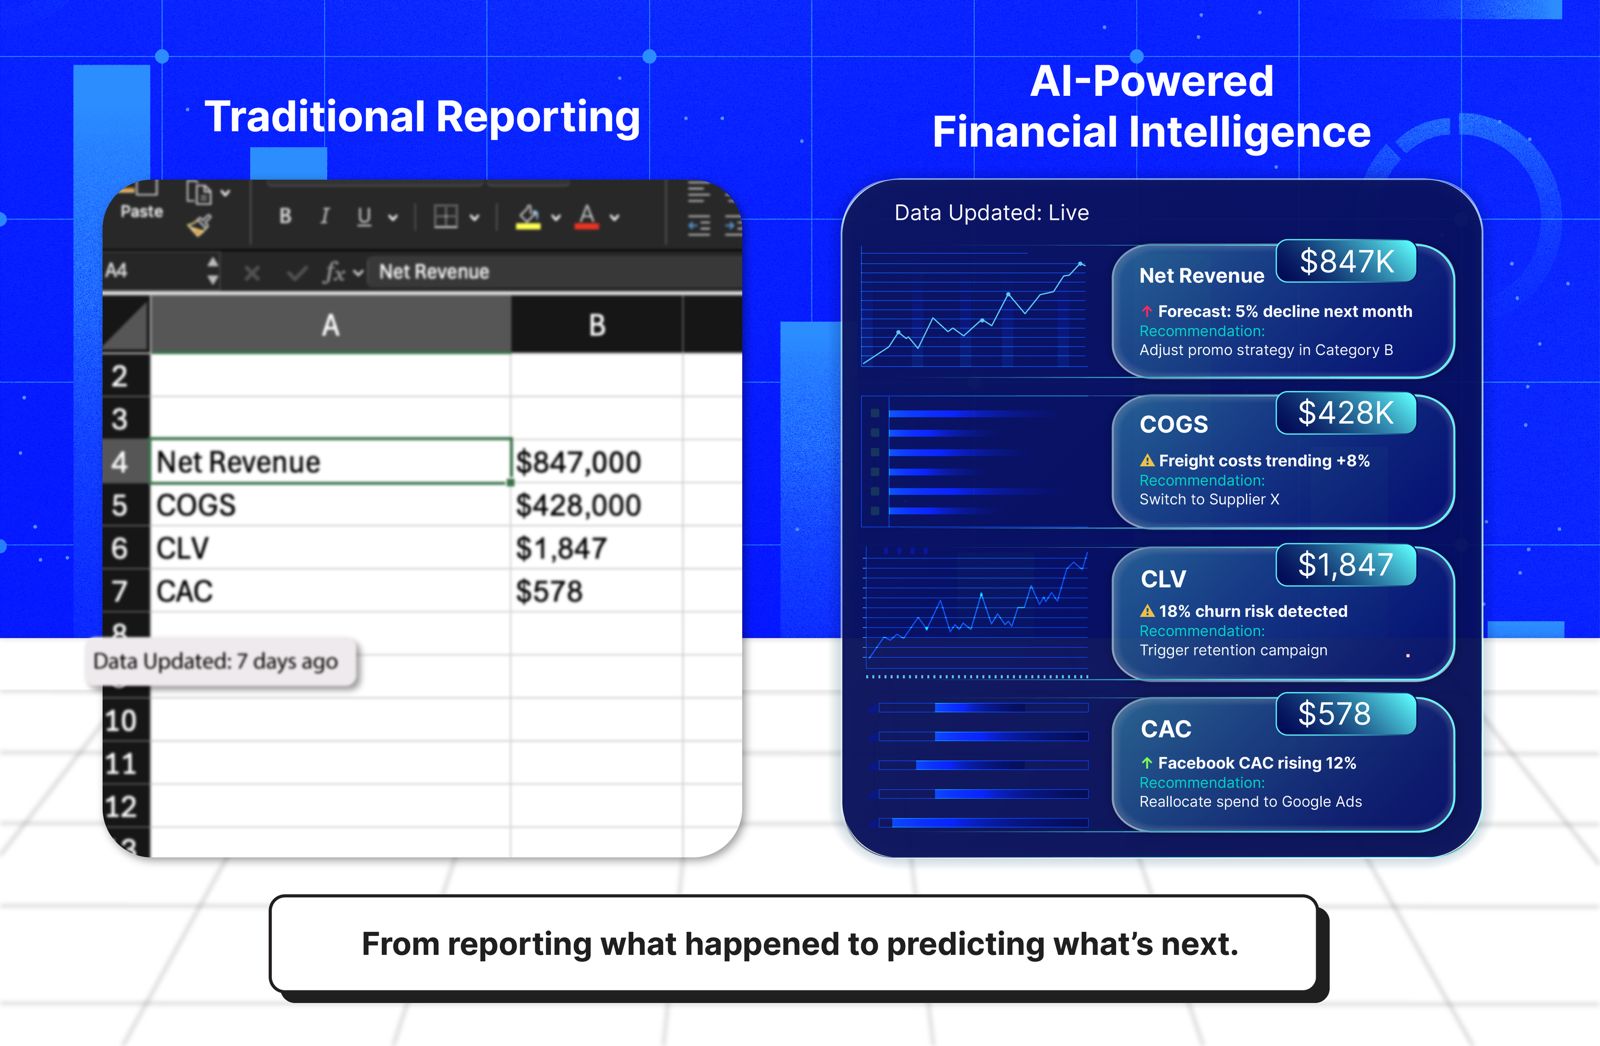
Traditional Tracking: $847K in Net Revenue last month.
Vs.
AI-powered TrackingRevenue is trending 8% below forecast. Margin pressure in Category B. Adjust promo strategy or shift inventory mix before Q2 targets are missed.
2. Average Order Value (With Segment Intelligence)
Aggregate AOV growth can create a false sense of improvement. AI segmentation reveals whether growth is driven by loyal customers while new customer purchase value declines.
This distinction matters. Rising AOV combined with declining acquisition quality signals future revenue risk, even when topline numbers look healthy.
Traditional Tracking: AOV is $127, up 3%.
Vs.
AI-powered TrackingRevenue is trending 8% below forecast. Margin pressure in Category B. Adjust promo strategy or shift inventory mix before Q2 targets are missed
3. Gross Margin Rate (With Product-Level Precision)
Blended margin metrics often mask differences in product-level profitability. AI analysis highlights which product categories sustain margins and which dilute profitability.
Finance teams gain early insight into how sales mix shifts will impact future profitability, allowing strategic adjustments in pricing, sourcing, or marketing investment.
Traditional Tracking: Blended GMR at 42.8%
Vs.
AI-powered Tracking: Product Line B at 18% margin, growing 40% faster than Line A: 55% margin. Projected blended margin drops to 38.2% by Q3 without intervention.
4. Cost of Goods Sold (With Supply Chain Foresight)
COGS is frequently analyzed retrospectively. AI introduces supply chain awareness into cost forecasting by monitoring supplier lead times, freight costs, and sourcing trends.
Instead of reacting to cost increases after they occur, finance teams can model supplier alternatives, anticipate cost spikes, and mitigate margin impact earlier.
Traditional Tracking: $428K COGS tracks to budget.
Vs.
AI-powered Tracking: Supplier lead times extended 2 weeks, freight up 8%. COGS on track to increase 6% next quarter. Alternative suppliers identified with 3% savings
5. Customer Lifetime Value (With Churn Prediction)
Traditional CLV measures past customer profitability. AI evaluates behavioral signals to detect early churn risk.
Changes in purchase frequency, engagement decline, or cohort behavior can indicate potential lifetime value erosion. Early detection enables targeted retention strategies that protect long-term revenue.
Traditional Tracking: $1,847 CLV for retained customers looks strong.
Vs.
AI-powered Tracking: 18% of the Q4 cohort is showing early churn signals. Projected CLV loss: $340K unless retention campaigns trigger within 2 weeks.
6. Cart Abandonment Rate (With Root Cause Diagnostics)
Cart abandonment is often tracked as a static benchmark. AI helps break abandonment into actionable drivers such as shipping cost sensitivity, checkout friction, or trust barriers.
By isolating root causes, organizations can prioritize fixes that directly improve conversion rather than treating abandonment as an industry norm.
Traditional Tracking: 68.4% abandonment, below the 70% industry average.
Vs.
AI-powered Tracking: 32% abandon due to shipping costs, 21% due to trust friction, and 15% due to mobile form issues. Prioritized fixes could recover $127K monthly.
7. LTV: CAC Ratio (With Channel Attribution)
Blended LTV: CAC ratios can hide inefficient marketing spend. AI channel-level attribution reveals which acquisition sources generate profitable customers and which reduce overall marketing efficiency.
This allows finance and marketing teams to dynamically reallocate spend toward channels that improve long-term unit economics.
Traditional Tracking: 3.2:1 LTV: CAC ratio exceeds benchmarks.
Vs.
AI-powered Tracking: Facebook at 1.9:1 (burning cash) and Google at 4.8:1 (underinvested). Reallocating $50K monthly improves the ratio to 4.1:1 and increases profitable customer volume by 22%.
What Modern Financial Metrics Tracking Requires
To make metrics actionable, finance teams need three foundational capabilities:
Continuous Data Integration: Unified data across commerce platforms, payment systems, marketing tools, and operational systems ensures metrics reflect current performance rather than delayed snapshots.
Predictive Context: Metrics must highlight expected future impact, not just historical variance.
Automated Insight Prioritization: Finance leaders need systems that surface the most critical performance drivers instead of requiring manual analysis across multiple dashboards.
The Real Shift: Metrics as Decision Infrastructure
The competitive advantage in modern e-commerce is no longer determined by which metrics companies track. Most organizations track similar KPIs. The difference lies in how quickly those metrics translate into action.
Once you experience the difference between "revenue was $847K" and "revenue will decline 15% next month unless you act on inventory gaps today," you won't go back.
High-performing finance teams treat financial metrics as operational intelligence layers that guide pricing, marketing, inventory, and customer strategy in real time.
E-commerce CFOs, start tracking your key financial metrics the right way to stay competitive.